Global Weather Patterns
For sailors traveling the world's oceans it is useful and important to know the general weather patterns of the world. When looking at weather charts on any given day, the weather patterns may seem chaotic. However, long-term averages reveal distinct and well-recognized global patterns.
The sun is the driving force behind all the weather on planet earth. The annual average net radiation flux of the earth-atmosphere system is positive between about 40°N and 40°S and negative poleward from that region. In other words, if there wasn't any energy transfer, the earth would warm up near the equator and cool down near the poles continuously. Because that doesn't happen in the nature, there must be some mechanisms that transfer energy between the equatorial regions and the poles. One of those mechanisms is - of course - winds. Ocean currents also transfer energy and that will be discussed in the upcoming articles.
If the earth had a uniform surface and rotated symmetrically around the sun, the weather patterns would be greatly simplified. However, in reality the inclination of the earth's axis, the rotation of the earth, irregular distribution of continents and oceans, different responses of different surfaces on solar radiation, and the distribution of mountain chains make the weather patterns of the earth more complex.

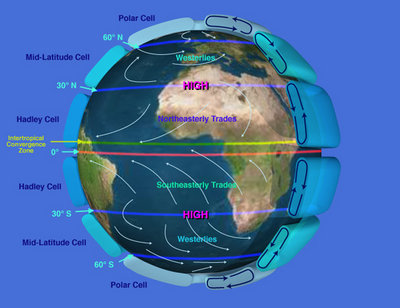
Figure 1. Global wind patterns and circulation cells. (Image courtesy of NASA.)
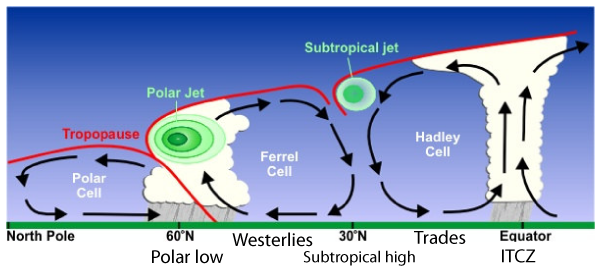
Figure 1 shows that northeasterly and southeasterly trade winds on the northern and southern hemisphere, respectively, transport air towards the equator. The trades meet at the Intertropical Convergence Zone (ITCZ), also known as doldrums, where the air rises up forming tall cumulonimbus clouds. These clouds can grow as tall as 15-18 km and produce thunderstorms and squall lines near the ocean surface. High up in the troposphere, the air flows northward in the northern hemisphere and southward in the southern hemisphere. Near latitude 30°, the air descends and warms up forming the subtropical high pressure. This circulation pattern between the equator and the subtropical high pressure is called the Hadley cell (Figure 2).

Figure 2. Circulation patterns in Hadley, Ferrel, and polar cells. (Image courtesy of NOAA.)
Between about 30 and 60 degrees latitude on both hemispheres is the mid-latitude or Ferrel cell. The mid-latitude westerlies or southwesterlies (northwesterlies on the southern hemisphere) transport air poleward. The air rises upward near 60th latitude in mid-latitude low pressures, returns equatorward in the upper troposphere and descends again in the subtropical high pressure.
Poleward of the mid-latitude cell is the polar cell. Near the earth's poles lays a semi-permanent high pressure and between the high pressure and the polar low is a belt of easterly winds.
The red line in Figure 2. illustrates the top of the troposphere - the tropopause. It is at lower altitude near the poles (8-10 km) and higher up in the tropics (16-18 km). The vertical downward motion in the high pressure area is very modest, in the order of a few millimeters to a few centimeters per second. In contrast, vertical updrafts in the cumulonimbus clouds can be as strong as 20-40 m/s. When the air rises up in the cumulonimbus clouds, the water vapor in the air condenses forming cloud droplets. In this process, large amounts of latent heat is released inside the cumulonimbus clouds and therefore they are sometimes called "hot towers". They also play a significant role in the world's heat budget. These tall cumulonimbus clouds are abundant in the ITCZ or doldrums where the trade winds from both hemispheres meet. The ITCZ is not a continuous band of thunderstorms around the world, but rather an area of evolving thunderstorm cells. These thunderstorms can grow and dissipate in a matter of hour(s), although some large organized cluster can live longer. Some sailors may cross the ITCZ without ever seeing a thunderstorm, some may experience gale-force winds and pouring rain.

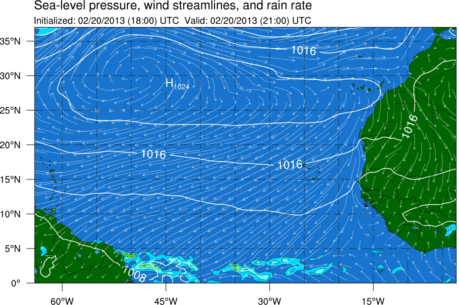
Figure 3. Subtropical high, trades, and ITCZ.
The Hadley cell is the most pronounced of the global circulation cells and can be often clearly seen on weather charts. In Figure 3, the subtropical high pressure is centered at 30°N and extends all across the Atlantic from the Canary Islands to Caribbean. The Intertropical Convergence Zone (ITCZ) can be seen between the equator and 5°N as an enhanced belt of precipitation. Between the high pressure and ITCZ is a very large and steady trade wind belt extending from 5°N to 25°N across the Atlantic.
In the next chapter, trade winds are discussed in more detail.


